
🔥New Seaborn vizaulization library release
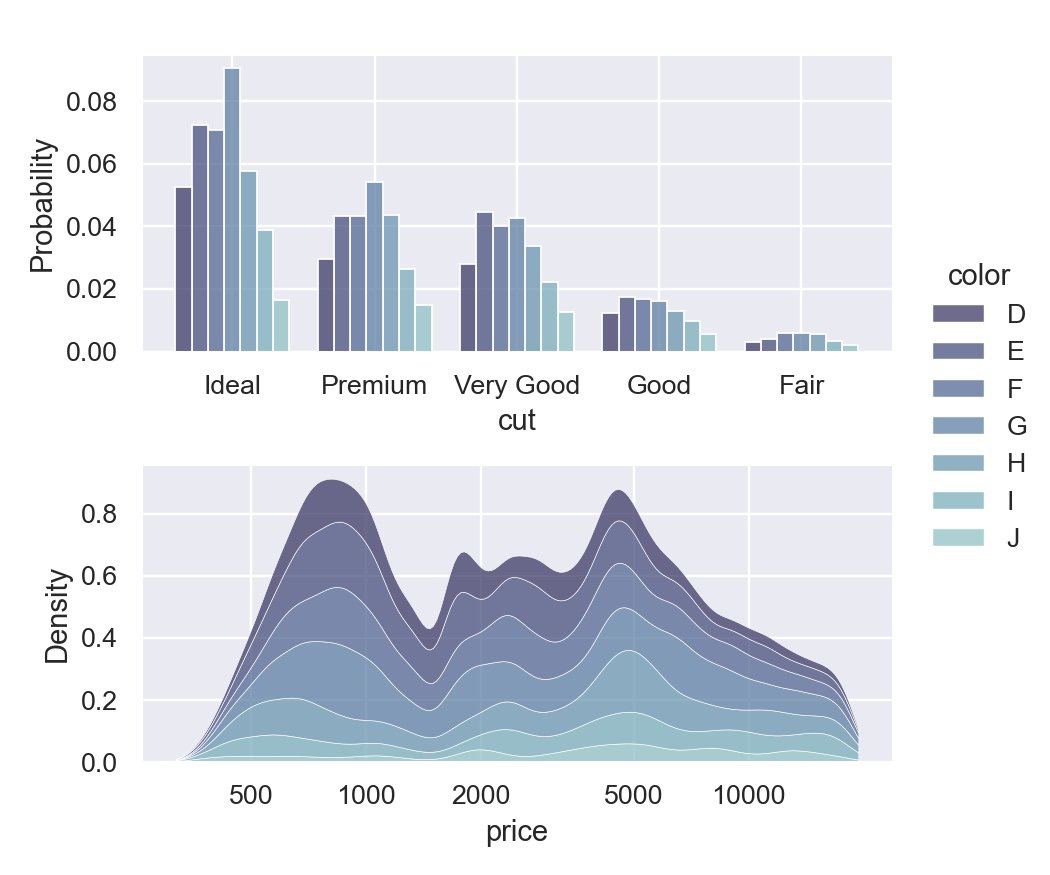
- completely new and improved distributions module, with a modern API and many new features, like these histograms and kernel density plots
- support for empirical distribution plots, a better way to compare multiple distributions
- better overall handling of categorical, datetime, and log-scaled data
- new perceptually-uniform colormaps that are optimized for use in scatter or line plots
- an API update that requires keyword arguments in most places, laying the groundwork for smoother integration of planned future enhancements
Medium post: https://medium.com/@michaelwaskom/announcing-the-release-of-seaborn-0-11-3df0341af042
Whats new: https://seaborn.pydata.org/whatsnew.html
#vizualization #seaborn