🎂🎉New Release - #Matplotlib 3.0.0. Supports Python 3. Highlights include:
GUI backend is selected at run-time based on what toolkits are installed;
New cyclic color map *twilight*;
Improvements to automatic layout of titles, ticks & GridSpec.
mail thread: https://mail.python.org/pipermail/matplotlib-announce/2018-September/000027.html
official site: https://matplotlib.org/users/whats_new.html
installation:
#visualization #dataviz
GUI backend is selected at run-time based on what toolkits are installed;
New cyclic color map *twilight*;
Improvements to automatic layout of titles, ticks & GridSpec.
mail thread: https://mail.python.org/pipermail/matplotlib-announce/2018-September/000027.html
official site: https://matplotlib.org/users/whats_new.html
installation:
pip install -U matplotlib#visualization #dataviz
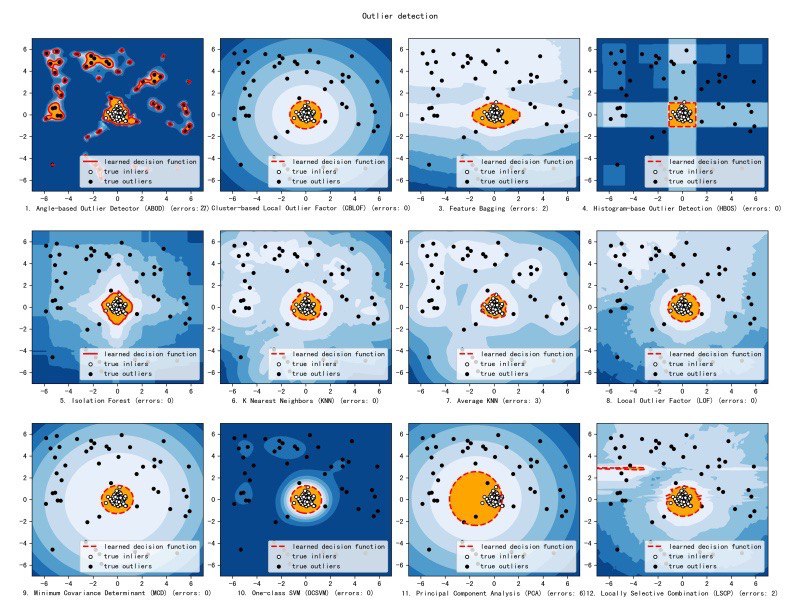
Intuitive Visualization of Outlier Detection Methods
Mostly with Python Outlier Detection.
Link: https://www.kdnuggets.com/2019/02/outlier-detection-methods-cheat-sheet.html
#outliers #dataviz #visualization
Mostly with Python Outlier Detection.
Link: https://www.kdnuggets.com/2019/02/outlier-detection-methods-cheat-sheet.html
#outliers #dataviz #visualization