
🐝 BUT BEFORE WE START - BTC UPDATE
The previous analysis has worked out, despite we didn't hold any position. The price reached $9600 mark. Then, $BTC started growing upward and do it that hard, that absorbed the whole downward movement and breakout of the upward triangle's border.
Now the price is re-testing the support level (previous resistance). In case the price would like to correct for a littie bit lower, there is located the support $10060 (triangle bottom) which should keep one above. Therefore, we have two support levels from where the price, more likely, will continue moving upward. Targets for this upward movement are mentioned on the chart. If we see that both supports are broken - it would mean that it is better to close the LONG position and take another look at the market.
ߋ cryptoklondike
BTC: Buy the Dip Opportunity You Can’t Miss
https://www.tradingview.com/chart/BTCUSD/HbfYnACw-BTC-Buy-the-Dip-Opportunity-You-Can-t-Miss/
️Don't forget to subscribe to our Trading View profile & press the like button. We would appreciate it.
BTC: Buy the Dip Opportunity You Can’t Miss
Many people compare the current Descending Triangle with one we had in 2018. The difference is that the 6k to 3k drop was in a downtrend - we are still in an uptrend. Different environment.
Let’s take a look at another Descending Triangle , which happened in Summer of 2017 at the peak of a bull run. We are definitely seeing some similarities with the current one.
Pay attention to one detail which I find interesting – the 147-Day EMA. It is an imitation of the 21-Week EMA , which supported the previous bull market just amazingly well. Now it’s coming into the floor of the Descending Triangle . So, in case of the triangle breakdown, we are going to violate the 21-Week EMA . And that’s the case we get a decent wick below the 21-Week EMA .
In 2017 the same 147 EMA (but on a 12h scale) was approaching the bottom of the Descending Triangle and then got broken with the triangle breakdown.
There’s a probability of having the so-called S
ߋ cryptobullet
Hello guys,
please spare some time to "LIKE, SHARE & COMMENT"
OneBtc approaching good accumulation zone
Looking closely on the trading pattern on OneBtc we can see a potential falling wedge which got broken upside and price aiming down for a re-test on the pattern set up before flying up. It worth keeping an eyes on.
https://www.tradingview.com/chart/ONEBTC/KtUSY54v-OneBtc-approaching-good-accumulation-zone/
OneBtc approaching good accumulation zone
Looking closely on the trading pattern on OneBtc we can see a potential falling wedge which got broken upside and price aiming down for a re-test on the pattern set up before flying up. It worth keeping an eyes on.
Kindly follow the suggested accumulation zone on the chart and always remember to apply stop loss according to your risk mitigation.
Level to watch for are:
POSSIBLE ENTRY ZONE
Possible Support LEVEL
SELL TARGETS
Do know that I appreciate your effort and the time spend in reading and watching my posts and Please leave a LIKE and FOLLOW us for more updates.
Thank you
Note:
It will be good to always understand risk involve in trading. Always trade with stop Loss in place.
Set up an entry/exit strategy for every trade, with good risk/reward ratio.
ߋ wcsechannel
Cryptomedication Volatility RSI Explainer/Guide
This should serve as a more useful guide on how this indicator works and how technical indicators serve useful for forecasting the market:
https://news.hash.fail/cryptomedication-volatility-rsi-explainer
ߋ zerononcense
This should serve as a more useful guide on how this indicator works and how technical indicators serve useful for forecasting the market:
https://news.hash.fail/cryptomedication-volatility-rsi-explainer
ߋ zerononcense
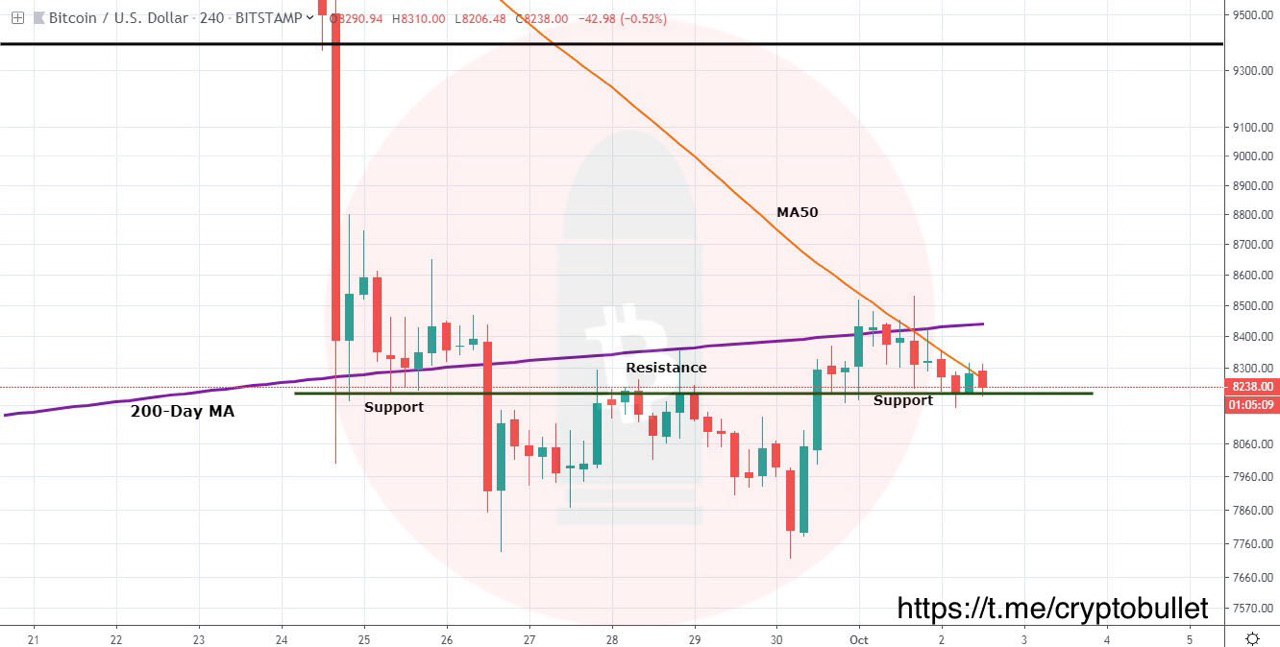
#BTC 4h
There is something to keep an eye on
This dark green line seems to be pretty good at supporting/resisting the price. Right now BTC is being squeezed between this support line and the 50MA on 4h. Be ready for a move.
Also pay attention to the 200-Day MA. It is key for the bulls. We really need to break above it to continue going up. Next major resistance to look for is around 9k.
ߋ cryptobullet
📍 #WPR
Looks juicy. The price has broken through the strong resistance and takes hold above the one. Makes sense to divide your entry orders: buy a half for a market price and another half in the orange rectangle. Targets are on the chart.
Link to the TradingView idea: https://www.tradingview.com/chart/WPRBTC/HVdic8ok-WPR-Growing-and-Doesn-t-Want-to-Stop/
ߋ cryptoklondike
📍 #LTC UPDATE
Looking at the global LTC chart we can easily find the global support level. Unfortunately, Litecoin is located very close to this level and ready to break one, moreover, the price is now in the distribution phase right inside this level.
As you might understand, this level is very strong, because it has rejected the price three times. Therefore, in case it will be broken, the overall bullish trend will be changed to the bearish .
Why do I think that this support will be broken? Bears tried to break it for 2 times before and usually it is needed only 3 times to break through the support. Moreover, all people who hold LONG position placed their stop losses before this level because of which it is a very juicy place to visit. Overall setup is bearish.
Link to the TradingView idea: https://www.tradingview.com/chart/LTCBTC/GuFl7mKU-LITECOIN-Overall-Setup-Is-Still-Bearish/
ߋ cryptoklondike
Overall just looks grim. CME did gap down which might generate some sort of bounce. https://www.tradingview.com/x/K2dTkKBj/
ߋ cryptotraider
ߋ cryptotraider
Price analysis BTC, ETH, XRP (10/07/19)
BTC / USD. Yesterday, sellers were able to push the psychological level of 8000.00 USD and continued to slowly push the price to the area of September lows. At night, the slide stopped at around 7780.00 USD. After a long consolidation, the lack of momentum is surprising. It is still difficult to clearly assess the upcoming market dynamics.
️In the four-hour and eight-hour time frames, indicator lines entered the oversold zone, but a buy signal has not yet been formed. Perhaps after some recovery, the BTC price decline will continue, but will there be enough strength for sellers to test the target mark of 7400.00 USD?
ETH / USD. Sellers yesterday sold an orange trend support line and tested the level of 61.8% Fibo (168.70 USD). This fibonacci retarded the pair from further decline and the price may recover above the hourly EMA55.
️If we assume that buyers are ready to increase volumes from this level of support, then recovery may continue to the area of 186.00 USD. If the trading volumes are low, then the recovery may be stuck at around 176.00 USD.
XRP / USD. Over the weekend, sellers failed to break through support for the EMA55, and the XRP price remained in the lateral range until the end of the week, with resistance at 0.260 USD.
However, today it is possible to break through this level and restore to 0.270 USD. Whether buyers will be able to gain a foothold in this area is not yet clear. It is possible that by the end of the day the pair will return to the POC line (0.253 USD)
ߋ bitco_novosti
️
#RLCBTC
Hey guys focus on the identified pattern.
https://www.tradingview.com/chart/RLCBTC/OhtPefp2-RLCBTC-trade-opportunity/
RLCBTC trade opportunity
Spotted potential identical breakout pattern here guys, if this play like before we should see some nice profit on RLC in coming days.
Just focus on the chart pattern and wait for a re-test on the accumulation zone for long action.
Do know that I appreciate your effort and the time spend in reading and watching my posts and Please leave a LIKE and FOLLOW us for more updates.
Thank you
ߋ wcsechannel
📍 #TOMO
The chart looks very positive. $TOMO is located in the very bullish net’s quarter, below the flat resistance. We should see an impulse after a breakout. Mentioned buy zone and targets on the chart.
Link to the TradingView idea: https://www.tradingview.com/chart/TOMOBTC/wdGzZMok-TOMO-Expect-an-Impulse-After-Breakout/
ߋ cryptoklondike
🐝 #BTC UPDATE
As long as the price is located below the descending resistance, namely, as long as $BTC stays inside the triangle with the flat support, the situation is bearish. This pattern (triangle with flat bottom) has the advantage to continue the downtrend. If the price through the descending resistance, there would be no way back. However, to continue the ascent, the asset needs a correction.
As we can see, there is brand new support - $8050 (magnet level). After reaching the $8050 level, the price will grow for a little bit, after which it will be decided whether it will break the resistance of the triangle, or go back to the triangle's support level.
I drew the arrow down because the triangle is bearish and the priority is downward. However, it is very important to understand, that in case of a breakout, the whole bearish scenario will be cancelled.
ߋ cryptoklondike
️
#DockBtc
Rising wedge spotted here guys, with coin already started correction mode. We should wait for it to breakdown and go long from 78.6% down towards 88.6% retracement level.
https://www.tradingview.com/x/bXvlYyq3/
ߋ wcsechannel
#DockBtc
Rising wedge spotted here guys, with coin already started correction mode. We should wait for it to breakdown and go long from 78.6% down towards 88.6% retracement level.
https://www.tradingview.com/x/bXvlYyq3/
ߋ wcsechannel
ADA chart update
ADA pulled back to the same SR zone and bounced, as forecasted. Already touched first resistance at 524. Should be growing further.
Last post: nearest target at 500 hit. Next 515 - 535 - 550.
Trade at Bitmex with up to 20x leverage
Trade ADA at Binance with margin
#Bitmex #ADA #Cardano
ߋ cryptotrades
BNB/USDT chart update
BNB reversing in USDT pair and growing in BTC. Considering BTC can make a sharp move soon, hard to predict, how will BNB react to that, but what is clear, is that it has the same chart as BTC and either coming back from the newly formed bottom now, or getting ready to go down by another 30-40% (to 10.5-11$), if BTC get dumped.
So what support zones do we have?
- 17.3 would be very bullish bounce
- 16.9 seem ok to continue trend and not that high
- 16.2 would be the only safe entry taking into consideration current market risks
What would be the targets?
- Nearest is obviously at 18.3
- Next 19 and 19.65.
- Finally most bullish and less possible 20.35. Reaching this level would indicate, that BNB is ready to reverse and start growing. Possible with mild bullish BTC.
P.S. I write that much, because you have to learn what stands behind each price action and decision. Trade with plan and don't get trapped.
#BNB #Binance
ߋ cryptotrades